(Credit: Pixabay)
Recently, Stuart Rothenberg, a longtime political analyst and columnist, had some advice for readers when they see conflicting pre-election poll results. Either “pick the poll you want to believe (as many do)” or “look below the top-line responses to understand each survey’s results.”
My reaction? No! Definitely not – to both suggestions.
The first is, of course, tongue-in-cheek. Still, some people find it a reassuring strategy. But if you’re interested in a reality-based view of the 2016 U.S. election, this step is not for you.
The second is a fool’s errand. Looking at the cross-tabs of a poll, even if such data are made available (and usually they are not), can be more confusing than enlightening. Sometimes, for example, there may be fewer minorities than expected, but maybe also more Democrats. Trying to determine the appropriate balance of all the subgroups is difficult for experienced pollsters, much more so for the average reader. If the pollster is highly rated (see here for one set of ratings), it’s best just to take the results at face value.
But that doesn’t mean we should trust the results of any one poll, no matter how good the pollster’s reputation. Rothenberg’s idea that we should fret over the results of any single poll is a tad…antediluvian. In the past three or four election cycles, several sites have emerged which aggregate poll results, so the interested readers need not delve into the complexities of any poll’s methodology. Instead, they can rely on the expertise of the aggregators.
Two such sites are HuffPollster and RealClearPolitics, the former showing (as of August 2, 2016) Hillary Clinton with an average lead of 5.9 percentage points (47.1% to 41.2%), and the latter showing Clinton ahead by 4.4 percentage points (46.4% to 42.0%).
If the polls of polls don’t suit your fancy, then a fourth approach is to look at the projection models, which typically tell us the probability that one or the other candidate will win the election.
One of the first to launch such an effort was Nate Silver at fivethirtyeight.com, when he projected the results of the 2008 election. In 2004, Sam Wang had already launched the Princeton Election Consortium, which also provides a probability estimate of the election outcomes. And this year, the Upshot at the New York Times launched its own election model. All of these rely principally on an analysis of poll results to make their projections. A fourth model is provided by Predictwise, based primarily on market shares (see here for an explanation).
As of August 1, these were the predictions for a Clinton victory:
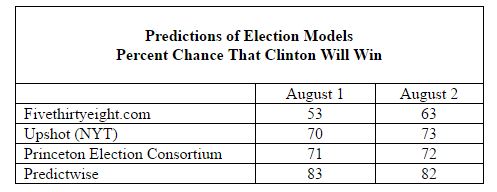
Note the major change in the Fivethirtyeight prediction from August 1 to August 2, with only little change among the others. Even among these models, there are significant differences – a 30-point difference between the highest and lowest percentages on August 1, and a 19-point difference the next day.
If the four approaches here don’t work for you – 1) picking the poll you like best, 2) examining the demographic details of polls, 3) looking to polls of polls, and 4) consulting the prediction models – a fifth approach is simply to wait until November 9, the day after the election. Then, perhaps, the outcome will be clearer, unless there is a close race as the one in 2000, which wasn’t resolved until more than a month later.
Remember, the prediction markets showed an 85% probability that the Brexit vote – whether Britain should “remain” or “leave” the European Union – would produce a majority in favor of “remain,” when in fact the vote went the opposite direction by four percentage points.
The polls and prediction models may be fun to follow, but as they warn consumers – the predictions are far from certain.