(Credit: Huffington Post, screenshot)
Mitt Romney was a news organization’s dream last week, when he resuscitated a moribund campaign with what many feel was a stellar debate performance. Now we’re all excitedly examining new polls to tell us exactly how big a bump he will get. And how long it will last (look quickly: It could be over even now).
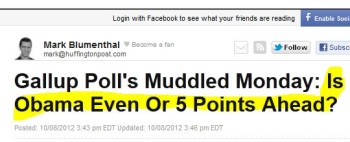
One of the problems is that different polls give us different readings, sometimes quite substantially different. As of this writing, it’s the Gallup Poll that suggests Romney’s debate bump has evaporated, and that Obama leads by five percentage points. But other polling organizations do not necessarily agree. Pew, for example, reports Romney leading by four percentage points – a 9-point polling difference in the standing of the two candidates.
These conflicts among polls are not unusual. In 2008, the major polls showed large variations, though they tended to converge right before Election Day.

The results in the chart above are based on weekly averages that I computed from the ten polls. Where there were daily results, I averaged them for the week. For some polling organizations, there was only one poll for the week.
Note that as late as the fourth week of October, one poll by Pew showed Obama up by 15 points, while another by GWU had Obama’s lead at only 3 points. Yet, the final predictions of these two polls were for Obama to win by 6 points and 5 points respectively (he won by 7 percentage points).
Another look at the differences among polls is to show the results of eight daily tracking polls during the month of October.
If you were trying to understand the dynamics of the election campaigns during October, you’d get very different views, depending on which of the polling organizations you followed. Some polls, like Zogby, Gallup and Daily Kos, show large fluctuations throughout the month. By contrast, GWU showed a large spike in the first half of October, but little change in the latter part of the month. Still, toward the end of the month, the polls got closer to each other.
One way to assess the amount of variation in the polls is to measure “variance” – a standard statistical figure. (For those who are interested, you can find a formula for the variance here.) I calculated the variance for each day and plotted it over the month of October, 2008. The results are shown below:

Overall, as the polls got closer to Election Day, the variance in the polls declined – though with three spikes. Each spike occurred after a debate – the vice presidential debate on Oct. 2, and the two remaining presidential debates on Oct. 7 and Oct. 15. Then there was a final spike just before the election.
One theory for the overall trend of convergence is that as voters made up their minds, different polls were less likely to produce wildly different results. The three spikes suggest that in the aftermath of the debates, voter sentiment might have been shaken by the arguments during the debate, but then they settled down – only to be shaken by the new debate.
I have no real explanation for the final minor spike, right before the election – unless it was a result of a final barrage of advertising on both sides.
I should point out that this “convergence mystery” (see here, here and here for a discussion of this phenomenon) has not been definitively solved! The 2008 election was the first time there were enough daily tracking polls to measure fluctuation for the month of October.
Still, the overall trend is unmistakable: Polls tend to agree more and more with each other as Election Day nears. In the meantime, be prepared for a wild ride.


