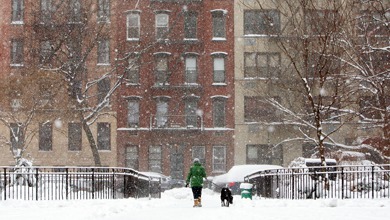

In a Feb. 15 post, blogger Rob Pitingolo complains about a front-page story in the Cleveland Plain Dealer. The story, “Cleveland named worst winter city as storm bears down on Northeast Ohio,” cited a Forbes report naming Cleveland number one in their ranking of “America’s Worst Winter Weather Cities” list.
Though Pitingolo targets the Plain Dealer for rebuke, Forbes itself seems to have made the more important errors here. Though it may be arguable whether or not the Plain Dealer was amiss in citing the list at face value (the newspaper’s ombudsman Ted Diadiun admitted in a response that he thinks the paper should have given a better description of the methodology for its readers to be able to judge the quality of the ranking), Forbes clearly made mistakes in the creation and description of this study.
iMediaEthics examined the methodology as described in the Forbes story, and found that though the study’s results are consistent with the methodology they describe, the suggested meaning of the list does not correspond to the results or the methodology of their report.
This is because the list Forbes stated that they created–the U.S. cities with the “worst” winter weather–can not be constructed with the measurement methods the magazine used. For example, only in the subtitle does Forbes make it clear what they actually measured–only the 50 largest cities– NOT all U.S. cities.
Forbes write: “These areas get the most snowfall and rain, and experience the coldest annual temperatures, of the 50 measured.”
But this short statement directly contradicts their title –“America’s Worst Winter Weather Cities.”
Readers are being misled. The title should be “Worst-Winter-Weather of America’s 50 Largest Cities.” But this new headline still does not cure the problems with this list.
Think about it. A city that has the coldest annual temperature, for example, does not necessarily have the coldest winter. Similarly, the one with the most snowfall and rain does not necessarily mean this precipitation is occurring in the winter.
Pitingolo also noticed another problem, writing on another Cleveland blog, “The most obvious question to ask about this ‘worst city’ list is ‘worst compared to whom’?” Forbes chose to define “city” according to the U.S. Census. It writes,
In compiling our list, we measured weather patterns in the country’s fifty largest cities, or Incorporated Places and Minor Civil Divisions as defined by the U.S. Census Bureau.
As Pitingolo rightly points out, this decision means that some cities that are larger (and colder) by other non-U.S.Census measurements were left off the list. While Pitingolo thinks it’s misleading for readers, the choice by Forbes is not necessarily scientifically problematic. The census definition of “city” may vary, but Forbes makes it clear that they select one and stick to it for its ranking as explained in their methods.
However, while their “city” definition may be fine, the list runs into another big problem with how it defines “winter weather”.
In the methodology description, Forbes reporter Tim Kiladze writes,
This data was provided by the National Oceanic and Atmospheric Administration (NOAA) and tracks average annual temperature, total precipitation in inches and total snowfall in inches. The temperature and precipitation data was calculated over a 30-year period from 1971 to 2000–NOAA’s most recent figures because of its decadal calculation schedule–and the snowfall levels included up to 2008.
This makes it sound like the report compared the annual average temperature of these 50 cities. If so, their description of the results again contradicts the methodology. Pitingolo explains why, writing,
Kiladze is using the year-round average temperature and the year-round average participation to draw normative conclusions about winter weather. This essentially means that any city with blisteringly hot summers is off-the-hook, regardless of what their winters are like, because the summer temperatures will skew the average. But it also means that cities with big variations in temperature benefit as well.
Consider that the average high January temperature in Minneapolis is a frigid 22 degrees Fahrenheit. In contrast, Cleveland averages 33 degrees in January – a significant 11 degree gap. But the average July temperature in Minneapolis is 83 degrees, versus only 81 degrees in Cleveland. When you average the numbers together, Minneapolis doesn’t look quite nearly as bad as it should.
It is possible that the list did look at winter temperatures and winter duration as sub-points of the “annual temperature” data set they describe. However, since Forbes does not describe doing this in their methodology , we must assume these steps did not take place.
iMediaEthics has tried to contact Forbes reporter Kiladze to ask about these issues. We will update with any response.
